
What we’re seeing in time‑to‑close, broken out by claim segment
Time to close is a straightforward metric, but it stays useful. It reflects how quickly a claim moves through the decisions that matter. That includes early evaluation, getting the right resources involved, keeping work from stalling, and landing on a resolution path that holds up.
Our data science team pulled a simple view for one of our clients. It shows closing timeline distributions across 10 years, 5 years, and 3 years, split across three segments:
lower severity claimants
higher severity claimants
filed suit, higher severity claimants
The 10 year view gives a longer baseline. The 5 and 3 year views show what has happened more recently, including the period since integrating with Quaker Analytics.
Instead of summarizing with an average, these charts show where claims cluster across time buckets (1 year, 2 years, 3 years, 4 years, 5+ years). That makes it easier to see what is becoming more common and what is becoming less common.
Lower severity claimants
In lower severity claims, the operational goal is consistency. You want clear triage, fewer stalled files, and faster movement to resolution when the claim supports it.
Across the charts below, the biggest change shows up in the last five years. The most common closing timeline shifts from 2 years to 1 year, and that pattern continues in the last three years.
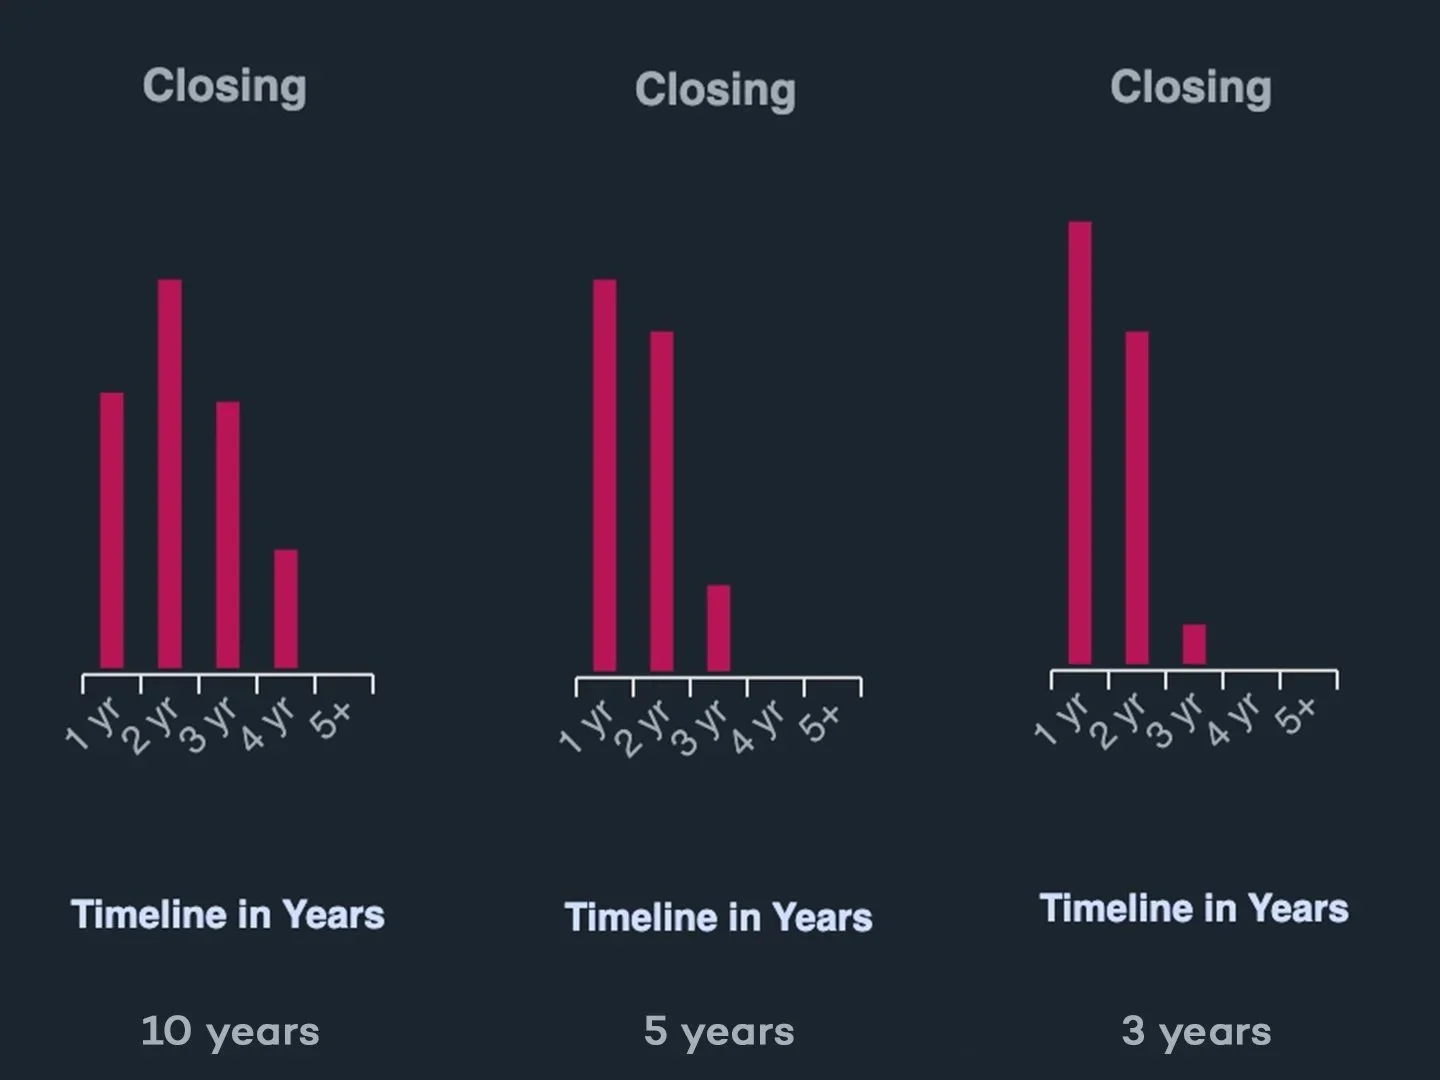
Lower severity claim closing timelines in years
In practice, we tend to see shifts like this when teams get better at early sorting and follow through. The work is not always easier. It just drifts less.
Higher severity claimants
Higher severity claims take longer and they vary more. The goal is not to pretend those claims should close in a year. The goal is to reduce avoidable delay. That includes late clarity on what is driving complexity, inconsistent handling paths, and slow escalation when a claim’s trajectory is becoming clear.
In this segment, the distribution moves earlier in the last five years. The largest bar shifts from 3 years to 2 years, and that trend holds in the last three years.
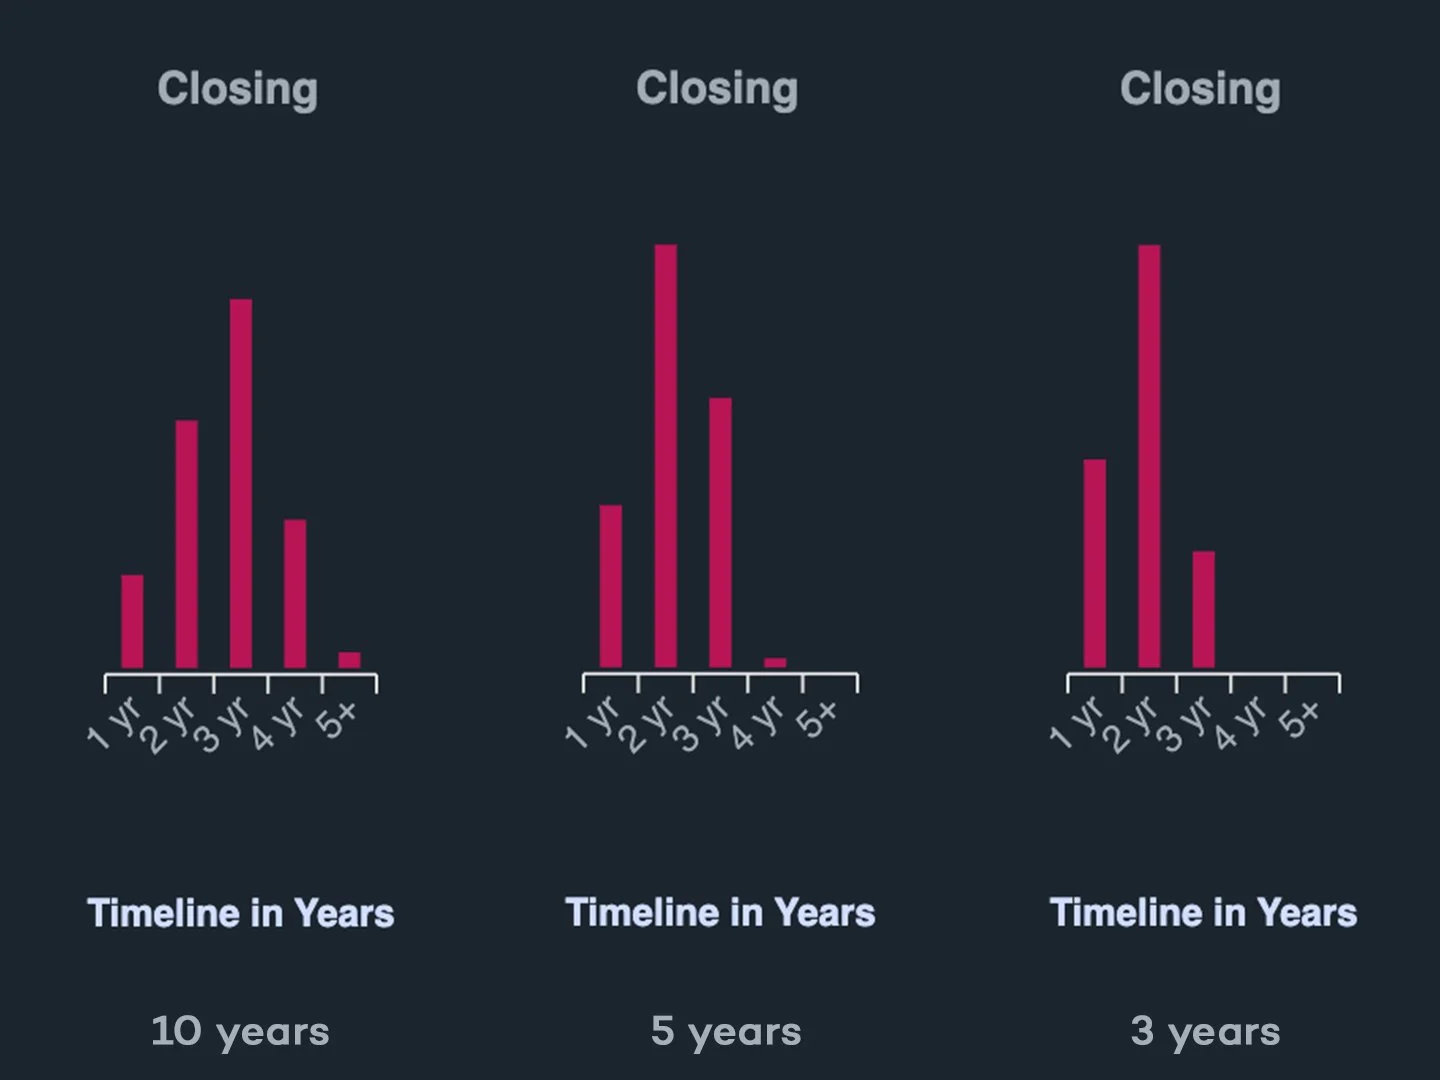
Higher severity claim closing timelines in years
This is usually what better decisions earlier looks like in severe claims. It is not a dramatic change across every file. It is a measurable shift in what is most common.
Filed suit, higher severity claimants
Filed suit plus higher severity is a tougher segment for most organizations. Workstreams branch. Timing depends on jurisdiction, counsel strategy, venue realities, and the specifics of the case. It is also a segment where analytics can fail to stick if it does not fit litigation workflows.
Here, the progression is more stepwise:
In the longer lookback, the most common closing timeline sits at 3 years.
In the last five years, it shifts toward a more even split across 2 to 3 years.
In the last three years, it shifts again toward a clear 2 year peak.
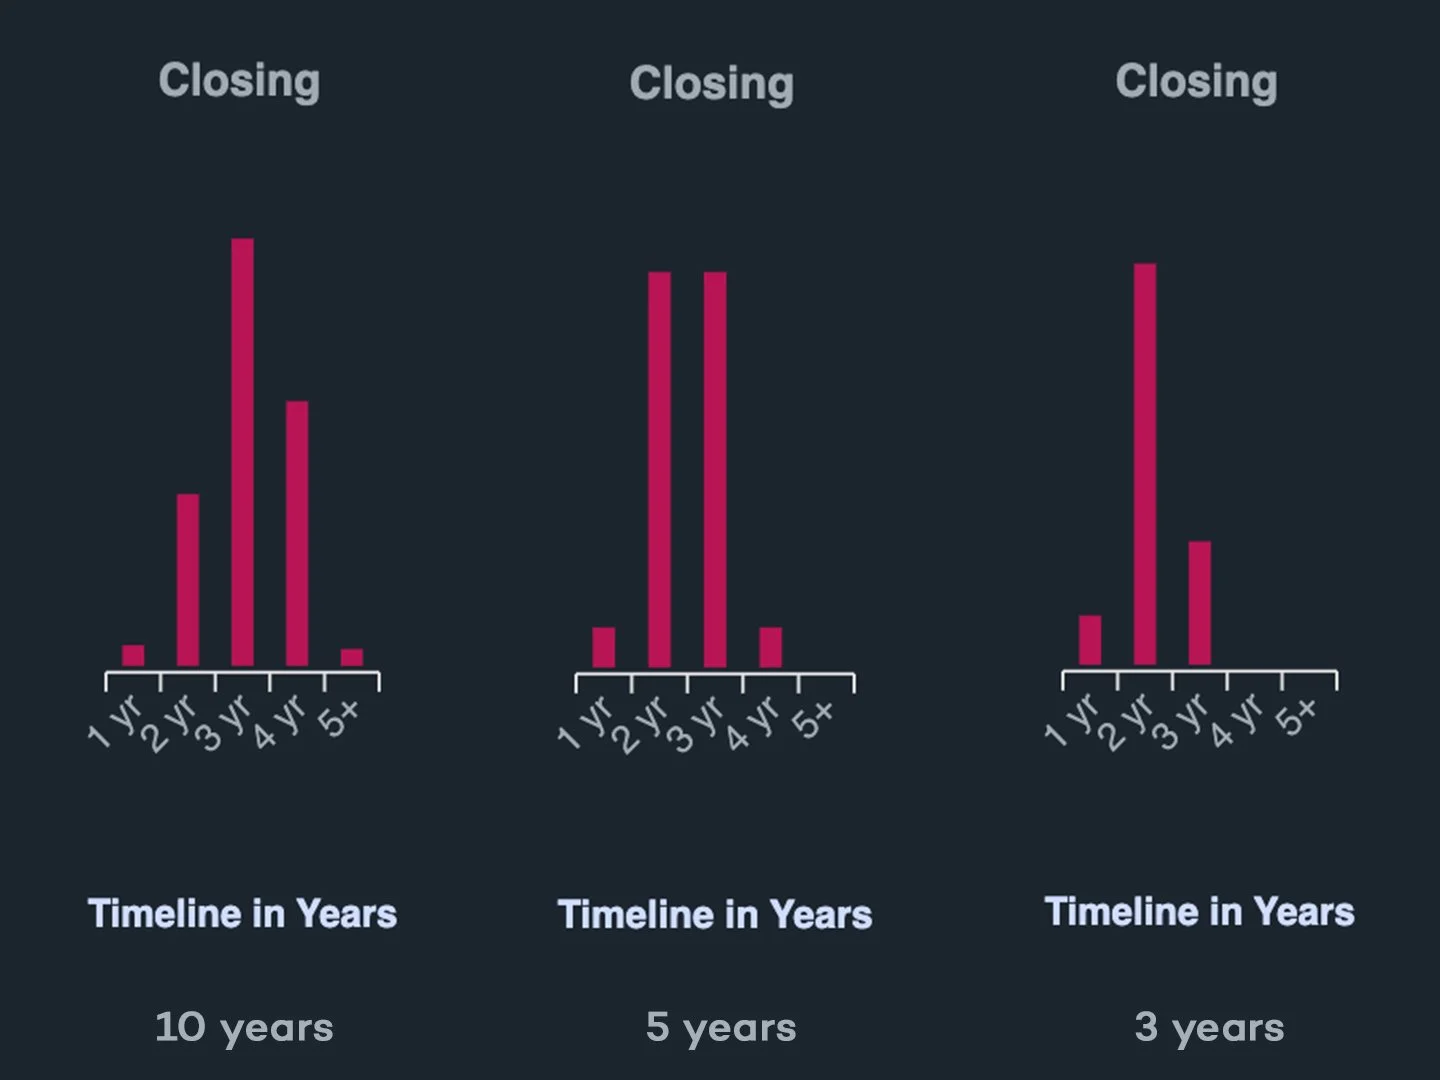
Filed suit higher severity claim closing timelines in years
That kind of movement usually comes from analytics plus day to day implementation. We can see it is not only about having models. It is also about getting usable insights into the places where they change what happens next. That includes triage, strategy, escalation, and consistency across handlers.
Why we look at 10, 5, and 3 years
We like this three window view because it helps separate signal from noise. A single year can be noisy. A long lookback can blur recent changes. Putting 10, 5, and 3 years side by side makes it easier to see whether a shift is sustained and whether it is strengthening.
For technical readers, these are distribution snapshots by time to close bucket. It is meant to be simple enough that a claims leader and a data science team can look at the same chart and agree on what changed.
Where Quaker tends to help in commercial auto claims
These results reflect the work our client’s claims team has done. Our role is to support that work with analytics that fits the way commercial auto claims are handled.
A few things that matter in practice:
Segmenting in a way that maps to action (severity and litigation posture drive different handling paths)
Getting decision support into the workflow, not parked in a dashboard that only gets visited after the fact
Measuring progress with simple, repeatable cuts, so it is clear whether changes are sticking
That is what the charts show. It is not a story about perfect claims. It is a measurable shift toward earlier closing timelines in segments where timing is important and often hard to change.
Notes for the data science readers (without turning this into a whitepaper)
If you’re the kind of person who wants to know “how did they actually compute that,” here’s the practical framing:
Metric: time-to-close, bucketed into year-based intervals (1, 2, 3, 4, 5+).
Stratification: distributions segmented by claimant severity and litigation posture (including filed suit).
Why distributions: because mean/median can improve while the long tail gets worse; distributions reveal where work accumulates.
How it’s used operationally: as a monitoring lens alongside leading indicators (triage accuracy, escalation timing, action completeness, and exception handling).
If your team is tracking only a single summary statistic for closure performance, you might be missing where the opportunity is—and where implementation is actually sticking.
Here’s a more straight-forward recap you can skim (you’re welcome)
If you don’t live in claims analytics every day, here is what this case study is showing and why we think it is worth paying attention to.
This article looks at one basic question: how long does it take for a claim to close. We call that “time to close.” It is not a perfect metric, but it is a practical one. When claims close sooner (in the right way), it usually means teams are getting to clarity earlier, avoiding stalled work, and moving claims down a consistent path.
Instead of showing one number like an average, the charts show where claims tend to land across simple time buckets: 1 year, 2 years, 3 years, 4 years, and 5+ years. Think of it as a quick visual answer to: “What is the most common closing timeline for this group of claims?”
We show those distributions across three time windows:
10 years as a longer baseline
5 years as the period since integrating with Quaker Analytics
3 years as a more recent check to see whether the changes are holding up
The charts are also broken into three groups because commercial auto claims do not all behave the same way:
Lower severity claims tend to be more straightforward and should close earlier when processes are consistent.
Higher severity claims are more complex and naturally take longer, but there is still room to reduce avoidable delay.
Filed suit plus higher severity claims are usually the hardest. Timelines depend on legal strategy, jurisdiction, and the details of the case.
Here is what we saw in this client portfolio:
Lower severity: Over the last five years, the most common closing timeline shifted from 2 years to 1 year. The last three years show the same pattern continuing.
Higher severity: Over the last five years, the most common closing timeline shifted from 3 years to 2 years, and the last three years show the trend continuing.
Filed suit, higher severity: Over time, the “peak” shifted from 3 years, to a more even split across 2 to 3 years, and then to a clearer 2 year peak in the most recent window.
Why that matters in everyday terms:
It suggests fewer claims are “drifting” into later years because the next steps were unclear or delayed.
It suggests decisions that affect speed and outcome are happening earlier. That includes triage, strategy, escalation, and follow through.
It shows improvement in the places where it is easier to stall. Filed suit and higher severity claims are where process variation and delays tend to pile up.
One important note: these charts do not prove that any single change caused the shift. Claims operations are complex, and results depend on the work done by the claims team. What the charts do provide is clear evidence of a sustained change in how long claims are staying open, broken out by claim segment and confirmed across multiple time windows.
Our role at Quaker is to support that kind of change with analytics that fits commercial auto claims work. That means segmenting claims in a way that maps to how they are handled, putting decision support where it can be used during the life of the claim, and measuring progress in a way that stays easy to understand.
If you only remember one thing from the case study, it is this: in this portfolio, the “most common” time to close moved earlier across lower severity, higher severity, and filed suit higher severity claims, and that shift showed up in both the 5 year and 3 year views.